
A Cost-Benefit Analysis for Wildlife Agencies
Human–wildlife conflict leaves little room for speculation. Agencies are expected to act quickly, justify expenditures, and defend outcomes—often under public, legal, and budgetary scrutiny. In that environment, wildlife monitoring technologies are not judged by novelty, but by whether they produce defensible decisions. This comparison focuses on thermal imaging versus eDNA as wildlife monitoring tools in active conflict management.
Two tools frequently proposed for conflict monitoring are thermal imaging and environmental DNA (eDNA). Both are non-invasive, increasingly accessible, and widely discussed. Both are also frequently misunderstood—particularly in the gap between detection capability and management outcomes.
This article examines where each tool performs well, where it fails, and what it actually costs to deploy, operate, and scale—so wildlife agencies can align technology choices with real management needs rather than expectations.

This analysis builds on our broader examination of emerging tools in wildlife management, focusing here on the cost-benefit tradeoffs between thermal imaging and environmental DNA for conflict species.
Table of Contents
What Wildlife Agencies Actually Need From Monitoring Technology
Before comparing tools, it’s important to define the criteria agencies implicitly use—whether or not they are written into procurement documents:
- Reliable detection, not theoretical accuracy
- Performance under real field conditions, not controlled trials
- Predictable costs across multi-year budget cycles
- Training requirements compatible with existing staff capacity and schedules
- Scalability without bottlenecks
- Defensible outputs that withstand public and legal scrutiny
Thermal imaging and eDNA each satisfy different parts of this list—and introduce different risks.
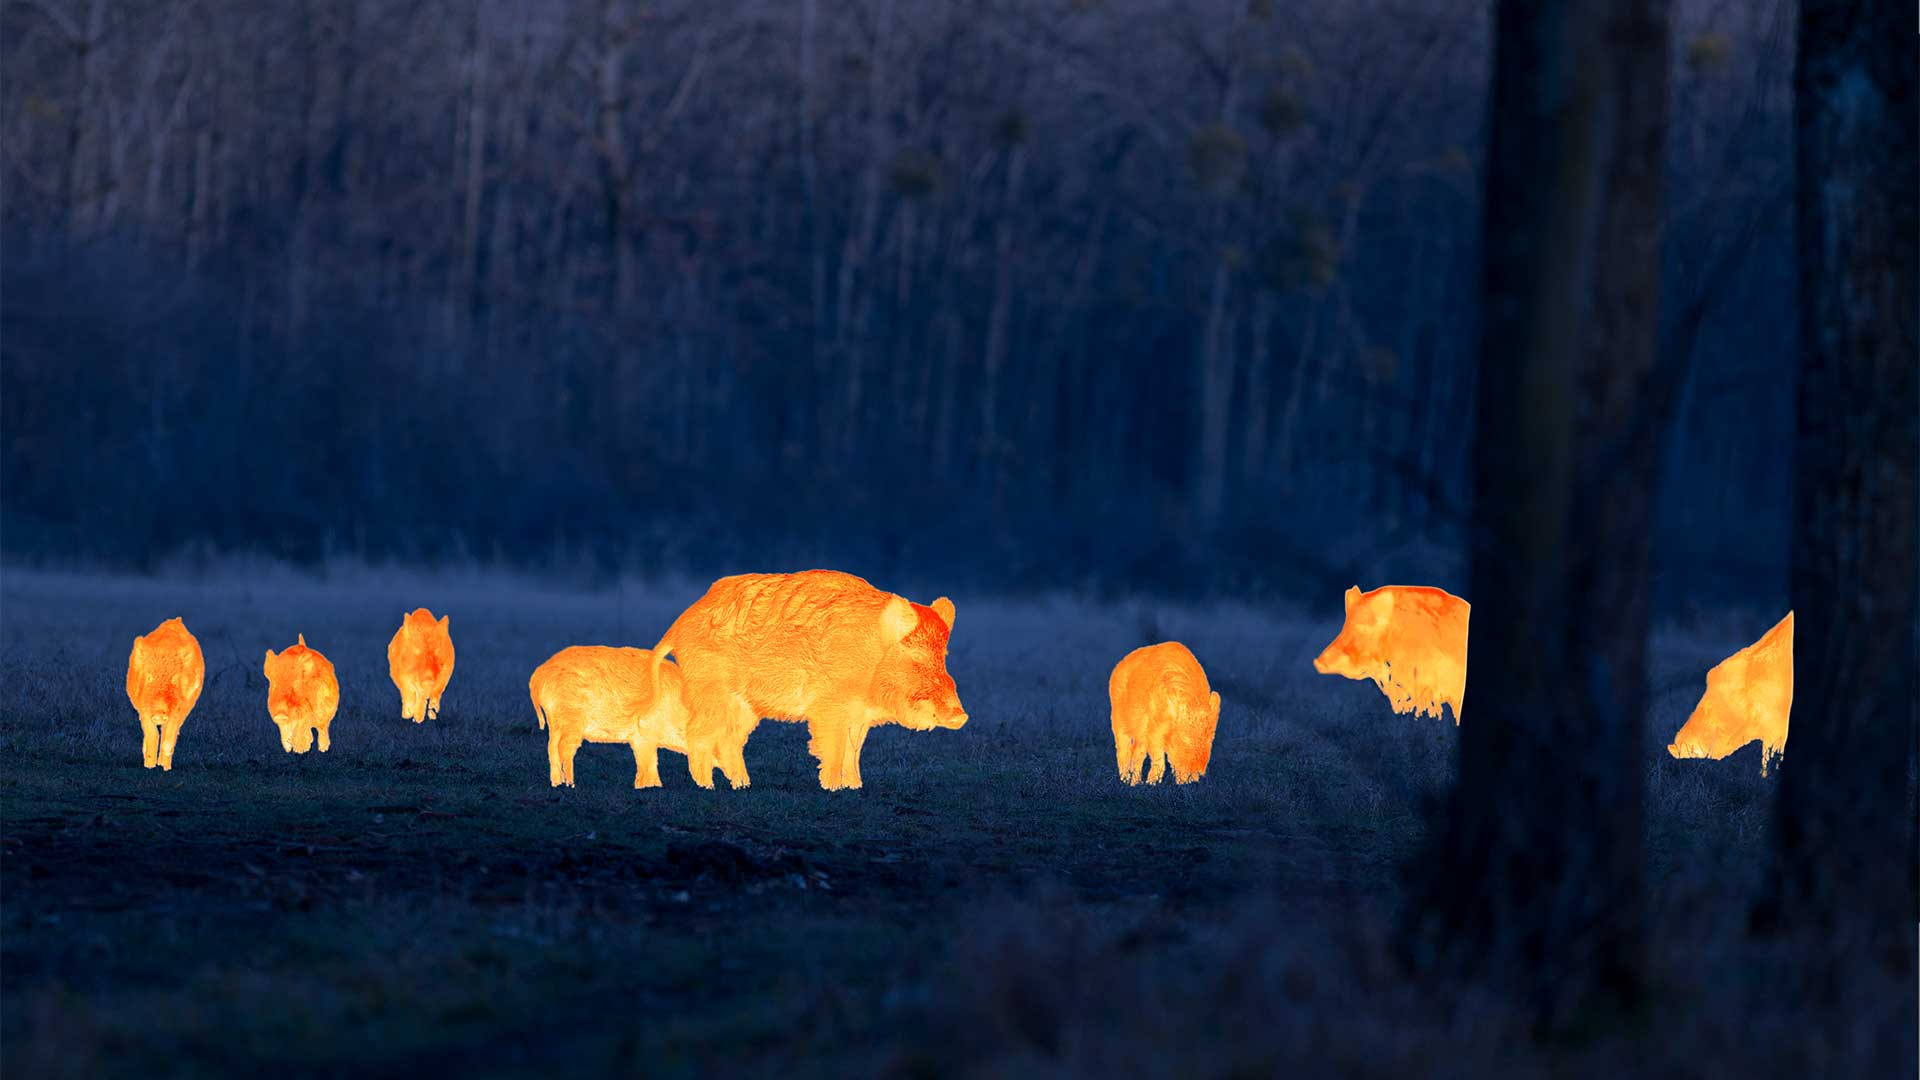
Thermal Imaging: Real-Time Detection for Active Conflict Zones
How Thermal Imaging Works in Wildlife Management
Thermal imaging detects animals by measuring heat differentials between body temperature and the surrounding environment. In wildlife management, it is commonly deployed as:
- Handheld thermal monoculars
- Fixed cameras along roads, corridors, or perimeters
- Drone-mounted thermal systems for targeted aerial surveys
Thermal imaging performs best with large-bodied mammals—including elk, deer, bears, wolves, and feral hogs—especially during low-light periods when visual detection is limited.
Detection Performance Under Real Conditions
Under optimal conditions—open terrain, low canopy, strong temperature contrast—thermal imaging systems routinely achieve 90–95% detection rates for large mammals. However, performance drops sharply in:
- Dense vegetation or forest canopy
- Heavy rain, fog, or snow
- High ambient temperatures that reduce thermal contrast
This variability is not a flaw in the technology; it is a constraint that must be acknowledged. Thermal imaging is situationally excellent, not universally reliable.

Costs, Training, and Operational Reality (2025)
Startup costs (2025 estimates):
- Entry-level handheld units: $5,000–$10,000
- Professional thermal drones (e.g., DJI Mavic 3 Enterprise Thermal–class or newer equivalents): $10,000–$30,000+
Recurring costs:
- Relatively low
- Batteries, routine maintenance, firmware/software updates
- Data storage for large thermal video files (often overlooked)
Training burden:
- Initial training typically ½ to 1 day for field technicians
- No formal certification required
- Occasional refreshers when software or workflows change
Thermal imaging integrates easily into existing field operations, but agencies should account for staff time spent reviewing footage, particularly in passive or long-duration deployments.
Thermal Imaging for Wildlife–Vehicle Collision Mitigation
Beyond detection, thermal imaging is increasingly used for real-time intervention, particularly in wildlife–vehicle collision (WVC) mitigation. Fixed thermal cameras paired with AI-assisted alert systems can trigger signage or warnings when animals approach roadways.
Pilot deployments in western North America report 20–30% reductions in collisions, though results remain preliminary and site-specific. This use case matters because WVCs cost the U.S. economy over $8 billion annually in vehicle damage, injuries, and fatalities—meaning even modest reductions can justify infrastructure investments.
Thermal imaging works here because speed matters more than certainty.
Environmental DNA (eDNA): Detecting Presence Without Direct Observation

What eDNA Can—and Cannot—Tell Agencies
Environmental DNA consists of genetic material shed into water or moist substrates through skin cells, waste, mucus, or decay. eDNA analysis can confirm whether a species has been present—even when visual detection fails.
However, eDNA provides presence-only data:
- No abundance estimates
- No behavioral information
- No precise timing of presence
It answers “Has this species been here?”, not “How many are there?” or “What are they doing?”
Detection Sensitivity and Reliability
When properly designed, qPCR-based eDNA assays can detect fewer than two DNA copies per microliter, making them exceptionally sensitive. This makes eDNA especially valuable for:
- Low-density populations
- Cryptic or nocturnal species
- Aquatic and semi-aquatic invasives
- Early detection before populations expand
Sensitivity is eDNA’s greatest strength—and also its greatest source of misinterpretation if results are not contextualized.
Costs, Training, and Hidden Constraints (2025)
Startup costs:
- qPCR instrument and essential supplies: $15,000–$25,000
(Assumes existing laboratory space, centrifuges, pipettes, and basic infrastructure)
Per-sample processing:
- In-house programs: $10–$50 per sample
- Commercial laboratories: $20–$150+ per sample, depending on volume and replication
Hidden operational costs (often underestimated):
- Cold-chain logistics
- Sterile field kits
- Quality assurance and contamination control
- Laboratory throughput limitations
Training burden:
- Initial laboratory training typically 3–5 days
- Annual refresher training often required
- May require off-site training or specialized staff
Turnaround Time: A Critical Clarification
eDNA processing itself can take 12–48 hours once samples are in the laboratory. However, total turnaround time—including field collection, shipping, queueing, and reporting—often ranges from weeks to over a month, particularly when laboratory capacity is limited.

This distinction matters. Detection may be rapid in theory, but management decisions are constrained by logistics, not qPCR speed.
Laboratory Capacity as the Limiting Factor
eDNA scales efficiently across landscapes—but laboratory throughput, not field effort, becomes the bottleneck.
For example: an agency may collect 200 stream samples in two weeks. If laboratory capacity allows processing of only 20 samples per week, final results may not be available for 2–3 months—often exceeding the window for effective intervention.
Real-World Agency Deployment
A strong example is the collaboration between the U.S. Fish and Wildlife Service and the Alaska Conservation Genetics Laboratory, where eDNA assays are used to screen hundreds of streams for invasive northern pike. By minimizing field labor while enabling early detection across large watersheds, this program has allowed agencies to respond to new invasions before populations become established—significantly reducing long-term eradication costs and limiting ecological damage.
Side-by-Side Cost–Benefit Comparison
| Factor | Thermal Imaging | eDNA |
|---|---|---|
| Detection Speed | Immediate | Delayed (weeks incl. logistics) |
| Habitat Suitability | Open terrain, low canopy | Aquatic / moist substrates |
| Startup Cost | $5k–$30k+ per unit | $15k–$25k (assuming lab infrastructure) |
| Ongoing Equipment Costs | Low (batteries, routine maintenance) | Moderate (per-sample consumables) |
| Hidden Operational Costs | Data storage, footage review time, software licenses | Cold-chain logistics, contamination control, lab queue delays |
| Training Burden | Low (½–1 day) | Moderate–high (3–5 days + refreshers) |
| Scalability Limit | Hardware & staff time | Laboratory throughput |
| Best Use Cases | Active conflict, WVC mitigation | Early detection, invasive surveillance |
For agencies balancing capital investment against operating costs, this comparison often determines technology selection.
Agencies deploying multiple thermal systems or using AI-assisted analysis may also incur annual software licensing costs.
In practice, thermal imaging is better when immediate detection matters, while eDNA is better for early detection across large areas.
Seasonal Performance Considerations
Seasonality plays a significant role in the effectiveness of both technologies and should be factored into deployment planning.
Thermal imaging performs best during cooler seasons and at night, when temperature differentials between animals and the environment are strongest. Performance often declines during summer months, particularly in warm regions where reduced thermal contrast and heat-retaining vegetation increase false negatives.
eDNA effectiveness is influenced by water temperature, UV exposure, and flow conditions. DNA degrades more rapidly in warm, sunlit, fast-moving water, while cooler temperatures and shaded streams improve detection persistence. Seasonal runoff and storm events can also dilute or redistribute DNA, affecting interpretation.
Agencies that align monitoring timelines with seasonal performance windows can significantly improve cost-effectiveness without changing tools.

Hybrid Strategies: Where Agencies Commonly Land
In practice, many agencies adopt hybrid workflows:
- eDNA surveillance detects presence across large landscapes
- Thermal imaging is deployed in confirmed hotspots
- Ground crews respond with targeted management actions
This sequencing improves funding justification, reduces unnecessary deployment, and aligns detection certainty with response speed.
When to Use Neither
Thermal imaging and eDNA are not always the right answer. In some contexts, traditional methods—camera traps, ground surveys, complaint data, or hunter reports—remain more cost-effective and actionable.
New tools should supplement, not automatically replace, proven approaches.
Public Trust, Legal Defensibility, and “Technology Theater”
Wildlife agencies face increasing pressure to “do something” about conflict. Expensive technology can create the appearance of action without measurable benefit—a dynamic often described as technology theater. Both thermal imaging and eDNA can fall into this trap when deployed without clear decision-making frameworks or when detection data fails to trigger meaningful management response.
Tools that generate data but do not improve decisions erode public trust, strain budgets, and complicate legal defensibility. Selecting technology because it fits management objectives—not because it looks advanced—is often the most defensible choice.
Legal and Regulatory Defensibility
Not all monitoring data carries the same weight in contested or regulatory contexts.
eDNA results are increasingly accepted for management decisions and early detection under invasive species programs, but their use in enforcement or endangered species violation proceedings varies by jurisdiction. Because eDNA confirms presence but not abundance, agencies typically require corroboration through visual confirmation or repeated sampling before taking regulatory action.
Thermal imaging data can provide direct visual evidence but may raise privacy considerations when deployed near private property or public infrastructure. Agencies often mitigate this by limiting camera fields of view, documenting placement rationale, and retaining footage only when wildlife detections occur.
In both cases, documentation standards matter. Clear protocols for data collection, chain of custody, metadata retention, and interpretation are essential for outputs to remain defensible under public records requests or legal challenge.
Final Takeaway
Thermal imaging and eDNA are not competing technologies. They are answers to different questions, operating on different timelines, with different cost structures.
Agencies that align technology choice with species ecology, operational reality, and decision timelines are better positioned to manage conflict effectively—and defend those decisions when scrutiny comes.
Wildlife monitoring technologies must be evaluated based on evidence, not novelty
Are you tracking a specific predator or trying to map your property’s total biodiversity? Tell us your goal in the comments and we’ll help you pick the right tech.
References
Thermal Imaging & Wildlife Detection
- Chrétien, L.-P., Théau, J., & Ménard, P. (2016). Thermal infrared remote sensing for wildlife detection and monitoring: Review and perspectives. Methods in Ecology and Evolution, 7(9), 1042–1053.
→ Foundational review on thermal detection performance and environmental limitations. - Mulero-Pázmány, M., Stolper, R., Van Essen, L. D., Negro, J. J., & Sassen, T. (2014). Unmanned aircraft systems for wildlife monitoring: A review. PLOS ONE, 9(9), e106336.
→ Supports drone-mounted thermal applications and field constraints. - Huijser, M. P., Fairbank, E. R., Camel-Means, W., Graham, J., Watson, V., Basting, P., & Becker, D. (2018). Effectiveness of wildlife–vehicle collision mitigation measures. Transportation Research Board, NCHRP Report 845.
→ Authoritative source for WVC mitigation outcomes and cost justification.
Environmental DNA (eDNA) Methods & Sensitivity
- Thomsen, P. F., & Willerslev, E. (2015). Environmental DNA – An emerging tool in conservation for monitoring past and present biodiversity. Biological Conservation, 183, 4–18.
→ Core citation for eDNA sensitivity, detection limits, and interpretation. - Goldberg, C. S., Strickler, K. M., & Pilliod, D. S. (2015). Moving environmental DNA methods from concept to practice for monitoring aquatic macroorganisms. Biological Conservation, 183, 1–3.
→ Addresses operational and methodological considerations for agencies. - Rees, H. C., Maddison, B. C., Middleditch, D. J., Patmore, J. R., & Gough, K. C. (2014). The detection of aquatic animal species using environmental DNA – a review of eDNA as a survey tool. Journal of Applied Ecology, 51(5), 1450–1459.
→ Useful for discussing presence-only data and limitations.
Agency & Applied Program Examples
- U.S. Fish and Wildlife Service. Conservation Genetics and eDNA Applications.
→ Agency documentation on applied eDNA use for invasive species detection. - Alaska Conservation Genetics Laboratory. Early Detection of Invasive Northern Pike Using Environmental DNA.
→ Program-level evidence supporting large-scale stream screening and early response. - Lodge, D. M., Turner, C. R., Jerde, C. L., Barnes, M. A., Chadderton, W. L., Egan, S. P., Feder, J. L., Mahon, A. R., & Pfrender, M. E. (2012). Conservation in a cup of water: Estimating biodiversity and population abundance from environmental DNA. Molecular Ecology, 21(11), 2555–2558.
→ Frequently cited in agency planning documents for early detection rationale.
Economic & Policy Context
- Insurance Institute for Highway Safety & Federal Highway Administration. Wildlife–Vehicle Collision Statistics and Economic Impacts.
→ Supports the ~$8 billion annual WVC cost estimate used for justification framing. - International Union for Conservation of Nature (IUCN). (2016). Biodiversity Monitoring Framework: Protected Areas and Conservation.
→ High-level guidance on monitoring costs, scalability, and program design.
Leave a Reply